
. . . But Will He Pay Out If Someone Explains Why the Report Doesn’t Show What He Thinks It Shows?
“This report is the sum of all ingenuity that crosses our desks and why American ingenuity has advanced society at a pace unmatched by any other country or society in human history—even to this day.”
“The report confirms the resounding and unassailable fact that the doorway to America’s Innovation Agency is, in both fact and deed, the entry point to indomitable prosperity. There is no better return on investment, than investing in American ingenuity.”
Per the above quotes, Director Squires continues to gush over the garbage-in-garbage-out Intellectual Property and the U.S. Economy 2024 report that I’ve already posted on twice.

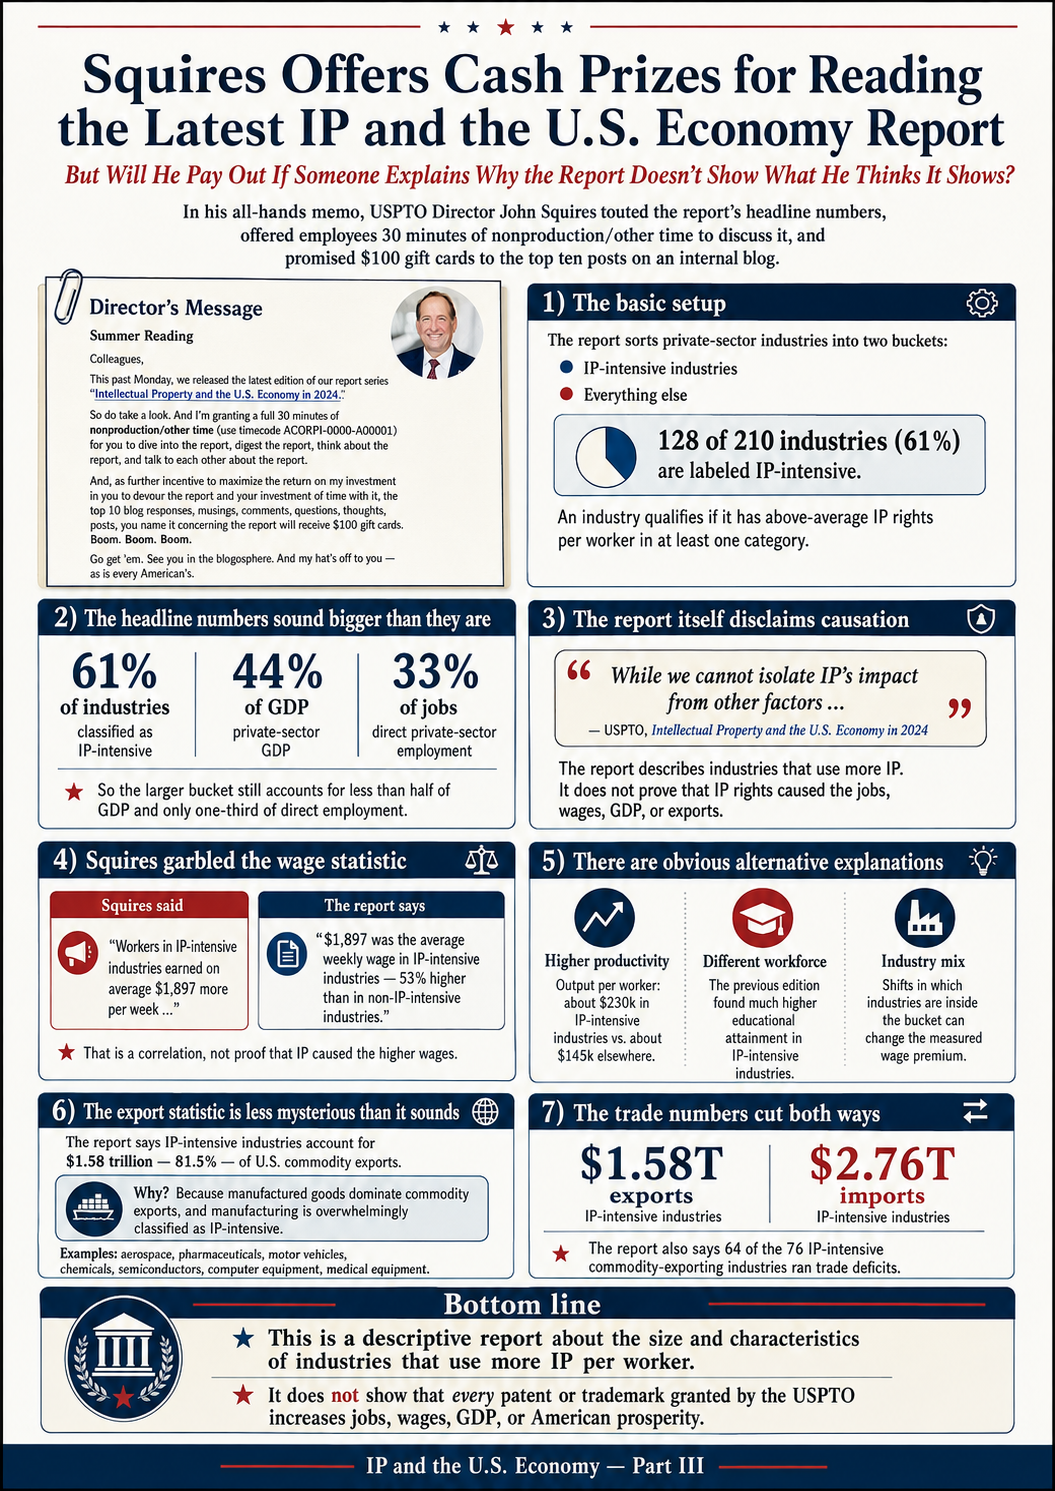
The quotes are from his Friday message to “colleagues” (OCR version below), in which he’s posted some of the report’s more impressive-sounding statistics and offers USPTO employees 30 minutes of nonproduction/other time to “dive into the report, digest the report, think about the report, and talk to each other about the report.” On top of that, he’ll award $100 gift cards to each of the top ten contributors to an internal “America’s Innovation Sonic Boom” blog he has set up to discuss the report.
I’m guessing many USPTO employees would prefer restoration of the union protections, bonuses, and other workplace benefits this administration has taken away to 30 minutes of other time and a lottery-ticket chance at $100.
I think I’ve already said just about everything I have to say about the report here and here.
So, to mix it up, I’ll write this one in Q&A format, centered on the statistics Squires is touting. If you’re a USPTO employee, feel free to post a version of this — or of my earlier posts — on the “America’s Innovation Sonic Boom blog.”
Q: The numbers sound impressive. How did the report arrive at “$11.4 trillion in economic contribution value to U.S. GDP (or 44% of total GDP),” and “Direct employment for 49.6 million workers (or 33% of total U.S. employment)”?
A: The report starts with 210 industries covering the U.S. private economy. For utility patents, design patents, and trademarks, it calculates how many IP rights each industry obtains relative to its number of employees. An industry is labeled “IP-intensive” if its IP-rights-per-worker figure exceeds the economy-wide benchmark for at least one type of IP. Copyright-intensive industries are identified separately. The report then divides the economy, for purposes of its headline statistics, into two groups: industries it labels “IP-intensive,” and all the rest.
Q: So ultimately there really are just two groups?
A: Right. And interestingly, the “IP-intensive” group is actually the larger one: 128 of the 210 industries — about 61%.
Q: And what percentage of jobs and GDP does that larger group account for?
A: Only 33% of direct private-sector employment and 44% of private-sector GDP.
Q: So how do we make that sound impressive?
A: Report the raw numbers. “49.6 million jobs” sounds like an enormous number, because it is. “$11.4 trillion” sounds enormous too. And “one-third of all jobs” and “44% of GDP” sound pretty good until you remember that those numbers represent the combined activity of 61% of the industries in the private economy.
Q: So what does this tell us about the importance of IP?
A: Practically nothing. As the report itself says: “While we cannot isolate IP’s impact from other factors, this exercise provides a useful benchmark to characterize the economic importance of industries that most heavily use IP protection and to compare the results to other countries.”
Q: So far, all we’ve really learned is that the industries the report calls “IP-intensive” account for fewer jobs and less GDP than the industries it does not call IP-intensive?
A: Right.
Q: So doesn’t the aggregate relationship actually run in the opposite direction from the story Squires is telling?
A: At this crude group level, yes. The group classified as more IP-intensive accounts for fewer jobs and less GDP than the group classified as non-IP-intensive.
Q: Does that mean IP causes lower employment or GDP?
A: Of course not. That would make exactly the same correlation/causation mistake. The point is that these numbers cannot support the opposite claim either — that IP rights caused the jobs or GDP Squires is touting.
And we shouldn’t lose sight of the causation problem, because it remains a complete answer to almost any causal claim someone might try to draw from this report. The report itself expressly acknowledges that limitation.
Q: What about Squires’s claim that “workers in IP-intensive industries earned on average $1,897 more per week than their counterparts in non-IP-intensive industries — that’s roughly 53% higher”? Doesn’t that show that IP-intensive industries produce better-paying jobs?
A: First, Squires has garbled the statistic. The report does not say that workers in IP-intensive industries earned $1,897 more per week. It says that $1,897 was their average weekly earnings, which was 53% higher than the average for workers in non-IP-intensive industries. Squires turned the wage itself into the wage differential.
But once that is corrected, this is actually a very good example of the correlation/causation problem. There really is a correlation here: workers in industries classified as IP-intensive earn substantially more than workers in other industries.
What the report does not show is why they earn more. It tells us only that industries whose workers earn more also happen to obtain above-average amounts of IP per worker. It does not tell us that IP rights caused the higher wages.
The reports themselves supply obvious alternative explanations. This year’s report attributes the wage difference at least in part to higher labor productivity, noting that output per worker is about $230,000 in IP-intensive industries versus $145,000 elsewhere. The previous edition also found dramatically higher educational attainment among workers in IP-intensive industries, which would naturally correlate with higher pay. And this year’s report expressly shows, in its discussion of copyright-intensive industries during COVID, that shifts in the mix of industries can change the measured wage premium. These are very different industries employing very different workers. Nothing in the analysis establishes that IP rights caused the wage difference.
Q: How does this report’s 53% “wage premium” compare with the previous report?
A: It’s actually down. The previous edition, using 2019 data, reported average weekly earnings of $1,517 in IP-intensive industries versus $947 elsewhere — a 60% premium.
Q: Does this report tell us anything about whether our standards for granting IP rights are optimal?
A: No. In fact, under this methodology, if the standards for obtaining patents or trademarks were substantially raised, the headline numbers could remain much the same.
Q: What if the standards were substantially lowered?
A: Same problem. The methodology ranks industries according to their relative use of IP. It does not tell us whether more IP, fewer IP rights, stronger IP rights, or weaker IP rights would produce more jobs or GDP.
A methodology that could produce essentially the same headline statistics under radically different amounts and strengths of IP protection cannot tell us that those statistics were caused by IP — much less that stronger IP rights would increase them.
Q: I can’t help noticing that the numbers for trademarks and design patents are both higher than those for utility patents. The report says trademark-intensive industries account for $9.46 trillion in GDP, design-patent-intensive industries $6.8 trillion, and utility-patent-intensive industries only $6.0 trillion. How should we interpret that?
A: Carefully.
The groups overlap substantially, so those figures cannot simply be added together. But if someone wants to treat the economic output of an “IP-intensive” industry as evidence of the importance of the particular IP right in question, then the report would appear to tell us that design patents contribute more to GDP than utility patents.
That is obviously not what the methodology can establish.
And yet after the previous report, those sorts of numbers were in fact used to emphasize the economic importance of design patents and to suggest that design-patent-intensive industries “drove” trillions of dollars of GDP.
That is the correlation/causation problem in especially vivid form.
Q: What about the export figures? Squires says IP-intensive industries account for $1.58 trillion — 81.5% — of all U.S. commodity exports, and that 18 of the 20 biggest commodity-exporting industries are IP-intensive. That sounds remarkable.
A: Until you look at what is actually being measured.
“Commodity exports” are physical goods, and U.S. exports of physical goods are dominated by manufacturing. Manufacturing, in turn, is overwhelmingly classified as IP-intensive under the report’s methodology.
The report’s leading IP-intensive exporters include aerospace products and parts, pharmaceuticals, petroleum and coal products, motor vehicles, basic chemicals, motor-vehicle parts, semiconductors, computer equipment, medical equipment, and communications equipment. The top 15 IP-intensive exporting industries alone account for more than half of all U.S. commodity exports.
By contrast, the report itself says that most of the non-IP-intensive commodity-exporting industries are in agriculture and raw materials.
So the 81.5% figure largely tells us that the industries that manufacture most of the things America exports also happen to be industries that this methodology labels IP-intensive.
Again, it tells us nothing about whether IP rights caused those exports — or whether exports would be higher, lower, or exactly the same with stronger or weaker IP rights.
Q: Anything else interesting about those trade numbers?
A: Yes. Squires trumpets the $1.58 trillion in exports, but the report also says that IP-intensive industries accounted for $2.76 trillion in commodity imports — 88.5% of all U.S. commodity imports. And 64 of the 76 IP-intensive commodity-exporting industries ran trade deficits.
That doesn’t mean IP caused the trade deficit either. It just illustrates once again why attaching causal significance to these industry classifications is so problematic.
Q: So is the report itself really the problem?
A: In an important sense, no. It is almost beating a dead horse to keep criticizing the methodology, because the report itself essentially acknowledges its central limitation: it cannot isolate the effect of IP from all the other things that distinguish these industries.
Q: Then why keep writing about it?
A: Because people keep using the report to make claims the report cannot support.
Squires is doing exactly that here. He tells USPTO employees:
“Every time you grant a patent or register a mark, you are keeping innovation alive. YOU are adding new opportunities for growth in the American job market. YOU are increasing our nation’s GDP. YOU are bolstering the American economy.”
He then calls IP “the very bedrock of American Exceptionalism itself” and says the report establishes the “resounding and unassailable fact” that the USPTO is the doorway to “indomitable prosperity.”
But the report establishes none of those things.
In fact, the report expressly says that it cannot isolate IP’s impact from other factors.
Q: So what does the report actually establish?
A: That some industries obtain more IP rights per worker than other industries, and that those industries have certain other characteristics.
That’s interesting descriptive information.
It is not evidence that every patent the USPTO grants creates a job, increases GDP, makes an investment worthwhile, or advances American society.
Q: One last thing?
A: There is another complication that the report largely leaves out: much of the economic activity being counted belongs to foreign-owned companies, and more than half of U.S. patents are now granted to at least one foreign applicant.
So even if the statistics had the causal meaning that Squires attributes to them, we would still have to ask who receives the resulting benefits. “Economic activity occurring in an IP-intensive U.S. industry” is not the same thing as “economic benefit flowing to Americans.”
But that is almost beside the point.
The basic problem is simpler: the report measures the size and characteristics of industries that use IP intensively. Squires is treating it as proof of what IP rights cause.
The report itself knows better.
Here’s an OCR’d version:
Director’s Message
Summer Reading
Colleagues,
IP roars. And American ingenuity roars loudest. How loud?
Try:
$11.4 trillion in economic contribution value to U.S. GDP (or 44% of total GDP)
Direct employment for 49.6 million workers (or 33% of total U.S. employment)
Indirect employment (jobs created in other industries that depend at least partially on final sales in IP-intensive industries) providing an additional 11% of total U.S. employment
This past Monday, we released the latest edition of our report series titled “Intellectual property and the U.S. economy in 2024” detailing just how profoundly the economic contributions of industries predominantly relying on IP protection supercharge the U.S. economy.
There it is in black and white: IP-intensive industries provide better paying jobs, employ one-third of total workforce, and account for 44% of U.S. gross domestic product (GDP). Boom. (pun intended).
What’s more, findings corroborate that workers in IP-intensive industries earned on average $1,897 more per week than their counterparts in non-IP-intensive industries—that’s roughly 53% higher and the differential continues growing. Overall, the wage premium for workers in the IP-intensive industries rose by 13% over the past decade.
Want to read in between the lines? It gets even better: in 2024, private sector output in the U.S. amounted to $26 trillion with IP-intensive industries accounting for nearly $11.4 trillion of this output. The U.S. exported commodities worth about $1.58 trillion, or 81.5% of all U.S. commodity exports across all industries in 2024. About 73% of the industries identified as commodity-exporting industries are IP-intensive, and of the top 20 commodity exporting industries, 18 are IP-intensive—that’s 90%. Broken down by IP type, that means:
Trademark-intensive industries accounted for $9.5 trillion in output and 54% of commodity exports
Utility patent-intensive accounted for $6 trillion in output and 76% of commodity exports
Design patent-intensive industries accounted for $6.8 trillion in output and 74% of commodity exports
Adjusting for inflation, total output for the IP-intensive industries in 2024 increased by an average of 3.6% per year over the 2019 estimates previously reported. This growth is higher than the 2.3% annual growth achieved by private sector GDP between 2019 and 2024. Boom.
You’ve heard me say time and again, you are the best in the world at what you do. Well, here it is in black and white for all the world to see.
And see they will, because in my follow-up “thank yous” for our WIPO bilateral meetings with over 30 international office heads, I’m personally writing to each and including a copy of the full report.
The past few years have witnessed unprecedented growth in intangible capital across countless sectors. And our nation will help lead these very sectors as we shape the next 250 years. America leads because no other nation comes close to our ability to conjure ideas, take risks, and reach breakthroughs—and see them through. And America’s Innovation Agency sets the bar through all of you.
The very IP protections sought by innovators and creators when they come to us are what motivate them to persist, to keep identifying problems, and to continue chasing solutions. Every time you grant a patent or register a mark, you are keeping innovation alive. YOU are adding new opportunities for growth in the American job market. YOU are increasing our nation’s GDP. YOU are bolstering the American economy. Because YOU are safeguarding their hard work, YOU are making every sacrifice, every setback, and every risk worth it.
You’ve also heard me say that time and again that every piece of intellectual property we put into circulation is a potential job, a new business, a new business development, an investible asset. Well, take a look at American ingenuity at scale.
And I do mean take a look. A hard look. This report is the sum of all ingenuity that crosses our desks and why American ingenuity has advanced society at a pace unmatched by any other country or society in human history—even to this day.
Indeed, IP is the very bedrock of American Exceptionalism itself. For us at America’s Innovation Agency in America’s 250th year, our mission remains the same as when the word “right” was at the tip of a quill pen and inscribed on Constitutional parchment just as it is written into every American’s DNA. These rights and protections we grant enable entrepreneurs to compete and investors to believe.
The report confirms the resounding and unassailable fact that the doorway to America’s Innovation Agency is, in both fact and deed, the entry point to indomitable prosperity. There is no better return on investment, than investing in American ingenuity.
So do take a look. And I’m doubling down and investing in your look-see. I’m granting a full 30 minutes of nonproduction/other time [use timecode ACORPI-0000-A00001] for you to dive into the report, digest the report, think about the report, and talk to each other about the report. I’ve set up a blog to do so, America’s Innovation Sonic Boom and I want you to have at it. Think of it as the Mother of all Musings—but I believe it’s that important. This is who we are, this is what we do—and no one on earth does it better.
And, as we are of course part of the Department of Commerce (not the Department of assigning homework even if it comes with other time 😉), as FURTHER incentive to maximize the return on my investment in you to devour the report and your investment of time with it, the top 10 blog responses, musings, comments, questions, thoughts, posits, you name it concerning the report will receive $100 gift cards. Boom. Boom. Boom.
Go get ’em. See you in the blogosphere. And my hat’s off to you—as is every American’s.
Leave a Reply